Why is housing inventory growing with higher mortgage rates?
The mortgage rate lockdown premise says that if rates rise, inventory can’t grow meaningfully. The idea is that nobody will trade their low mortgage rates to buy another home — even though this happened every week last year. Of course, I have a different view. My podcast partner, Editor in Chief Sarah Wheeler, disagrees, along with many others. You can see our debate on this topic here.
Let’s take a look at the inventory data this year to test this premise, since for many months it has been a working theory of mine that new listings data behavior last year marked a bottom and even going into 2024 we should see more sellers.
Weekly housing inventory data
Mortgage rates are still above 7% and haven’t been able to break below 6.50% for some time now. With mortgage rates higher, will this stop inventory from growing year over year? Some would say yes, on a year-over-year basis, of course.
Inventory is very seasonal, and we are about to start our seasonal increase in inventory. But even before that seasonal boost, we are showing year over year growth in inventory despite higher rates. Most home sellers are buyers of homes, so the action we are seeing this year is a healthy step in the right direction to get more balance in the housing market.
Here is a look at inventory last week:
- Weekly inventory change (Feb. 23-March 1): Inventory rose from 497,608 to 498,339
- The same week the previous year (Feb. 24-March): Inventory fell from 430,395 to 419,419
- The recent inventory bottom was in 2022 at 240,194
- The inventory peak for 2023 was 569,898
- For some context, active listings for this week in 2015 were 958,304
New listings data
New listings data is growing yearly, but it’s still a bit too low for my liking in 2024; I had hoped for more by this point. Now that we are entering the spring selling season when active inventory typically grows, we should get a boost over the next few months on the new listings data to match the spring season in previous years — and certainly above 2023 levels.
Weekly new listing data for the last week over several previous years:
- 2024: 52,189
- 2023: 48,156
- 2022: 49,019
As we head into the seasonal inventory increase, we will watch how higher rates impact inventory data. Last year, I was looking for inventory to grow between 11,000 and 17,000 per week if mortgage rates exceeded 7.25%. I will still look for inventory to grow at this level this year with higher rates. Also, if mortgage rates head lower again, then we need to track how this impacts the new listings and inventory as well. I have a simple inventory growth model: as mortgage rates head higher, this can lead to weakness in demand, which means it takes longer to sell a home and inventory can grow.
Price-cut percentage
Every year, one-third of all homes take a price cut before selling — this is regular housing activity, and this data line is very seasonal. When mortgage rates move higher and demand gets hit, the price-cut percentage can grow. When rates fall, they can head lower than an average year.
Inventory is higher than last year and we might have found the bottom already in inventory, so as the year moves on, the price cut percentage data should be rising. We will keep an eye out on this to see if any actual aggressive trends happen either way.
Here is the price cut percentage for the last week over the past several years
- 2024: 30.5%
- 2023: 31%
- 2022: 17.2 %
Mortgage rates and the 10-year yield
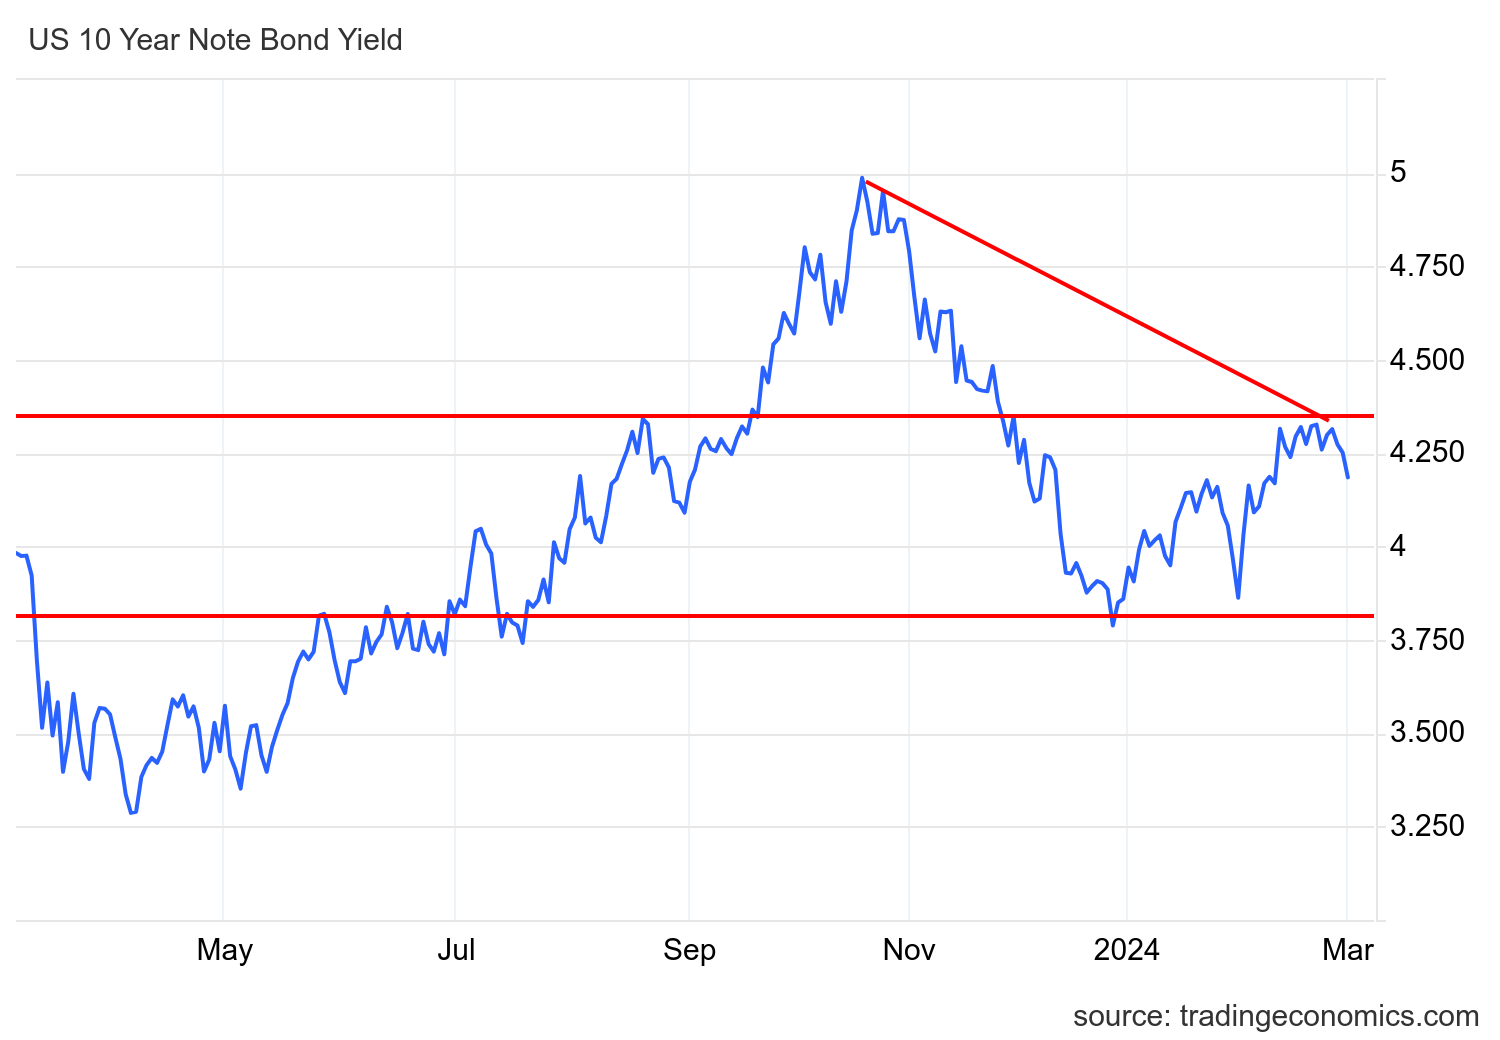
The 10-year yield is the key for housing in 2024. In my 2024 forecast, I put the 10-year yield range between 3.21%-4.25%, with a critical line in the sand at 3.37%. If the economic data stays firm, we shouldn’t break below 3.21%, but if the labor data gets weaker, that line in the sand will be tested. This means mortgage rates should stay between 5.75%-7.25% with a baseline assumption that the spreads will be bad for most of the year. The 10-year yield has traded above 4.25%, but mortgage rates never got to 7.25%, so the spreads have acted better than I thought they would.
We dodged a bullet last week as the PCE inflation data was muted. Headline PCE inflation for 12 months is running at 2.4%. We were very close to breaking over the critical line in the sand I have been talking about at 4.34%, but it didn’t break and we ended the week at 4.18%. We had some softer economic data come out on Friday and commentary from Fed presidents, so the 10-year yield was having a Friday block party, as you can see below.

As we have discussed, the 3.80% level for the 10-year yield is crucial, and the 4.34% level is critical. We haven’t broken either yet. We don’t want to break over 4.34% because we would see some more market drama and mortgage rates could head much higher. With the negative purchase application data we have had recently, the last thing we want is for the 10-year yield to get above 4.34%, which would mean dealing with mortgage rates between 7.25%-8% in a marketplace that is already slowing down with higher rates.
Mortgage rates didn’t move much last week and we haven’t hit my peak mortgage rate call of 7.25% yet with bond yields this high. We have jobs Friday coming up this week, so that will be interesting. The 10-year yield and mortgage rates have been wild since March 2022.
Purchase application data
Since mortgage rates have been rising toward 7% and above, the purchase application data has been trending negative on a weekly basis this year. We have had five weeks of negative data, which broke our positive streak of eight weeks when rates were falling. While this marketplace isn’t the crashing home sales marketplace of 2022, it’s not growing, so we will be hovering around this 4 million mark for a while until we see lower rates.
Since November 2023, we have had eight positive and five negative purchase application prints after making holiday adjustments. Year to date, we have had two positive prints versus five negative prints. This is a carbon copy of what happened in 2023 when rates went higher. However, we worked from a lower bar in home sales until 2024. So, don’t expect a massive existing home sales print in the next NAR existing home sales report like we did last year.
Week ahead: Buckle up for jobs week!
Here comes the jobs report with the 10-year yield still close enough to the critical technical level, making this week very interesting. This week we will get job openings, ADP, jobless claims and the BLS jobs Friday report. Since I am a labor-over-inflation guy, this week means a lot to my work for housing because I believe the housing market moves with the 10-year yield.
